Real-time, Interactive Data Analysis
The Big Picture
Conducting traditional Q-Methodology studies has been logistically difficult. Processing and analyzing the results have been just as conceptually difficult. The statistical processes are well-documented in Steven Brown’s book Political Subjectivity but investigators doing Q analysis have suffered a dearth of good tools. Standard statistical packages lack some of the features that Q requires, and the primary tool that most use, PQMethod, is a quirky command-line application consisting of public-domain FORTRAN code written for mainframes by John Atkinson at Kent State University in 1992.
Q-Assessor re-implements the algorithms described by Brown and instantiated in PQMethod and wraps them into a web-based interface that gives investigators a much clearer, more responsive, real-time, interactive ability to analyze their Q data. Q-Assessor’s procedures automatically process data deposited into its database by subjects performing their online sorts and deliver instant results. Here is how Q-Assessor does it.
Selecting the Data
Q-Assessor’s analyses all begin with the data submitted by subjects into its database. By default, Q-Assessor will use all subject responses for the Study, but as discussed in the prior “Managing Data” section, you can manually exclude specific subject responses if you have some reason for doing so. You should make sure that all the values you want analyzed are included in the data set at the point that you proceed.
Dealing with “R-style” Data
One of the inadvertent complications with online data systems like Q-Assessor — as compared to the old in-person, on-paper form of Q administration — is that investigators are inclined to collect hundreds and even thousands of responses. Unfortunately, not only is this practice inconsistent with basic Q methodology — and is routinely excoriated by Q traditionalists — it also produces excessive loads on any online server like Q-Assessor. In order to prevent any one investigator’s excessive demands from compromising all other users, Q-Assesssor checks the data size (in terms of the number of statements and the number of sorts of those statements) and only provides online analysis for conventional-sized data sets. Excessive data sets must be analyzed offline on the investigator’s own computer using PQMethod or other desktop analysis program after using the download and export functions that Q-Assessor provides. Read more here.
Beginning the Analysis
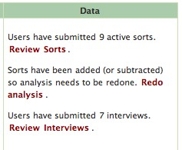
Q-Assessor lets you analyze your data at any point. You can wait until all the subjects have responded, or you can effortlessly look at results as they come in. The “Data” panel in the upper right corner of a Study’s main summary page keeps you posted on the state of the data and analysis.
As new subject data arrive in the database, Q-Assessor keeps you posted and lets you know that they need to be analyzed. If you had previously done an analysis and a new response comes in, Q-Assessor will automatically redo the analysis when you click on the “Redo Analysis” link. |
|
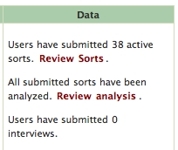
When all of the data are in and you’ve done an analysis once, Q-Assessor saves the analytic results as far as you’ve taken them and let’s you know that you can simply resume the analysis where you left off. |
|
Unlike PQMethod or other statistical tools, Q-Assessor does not require you to manually enter any of the subject data. Q-Assessor automatically pulls the data from the database — where the subjects put it themselves — and analyzes it.
Generating Unrotated Factors
The first step of any Q analysis is to generate the unrotated factors. This can be done by one of two methods — the Centroid method, or Principal Component Analysis (PCA). Brown makes a theoretical argument in his book on the superiority of the Centroid method, and this is the approach that Q-Assessor uses.
We chose the Centroid method partly on the strength of Brown’s arguments and partly on some peculiar behavior we discovered while trying to port PQMethod’s algorithm for the PCA technique. PQMethod’s PCA calculations involve operands very close to zero positively and negatively at a number of critical points, and how a given compiler’s implementation of floating point math works ends up having a large impact on results from these calculations. We found it impossible to replicate PCA-calculated factors in Ruby that PQMethod produced, and in fact we found varying PCA results from PQMethod compiled for one operating system vs another operating system. However, Centroid calculations appear not to have this same unpredictability, and so that is the approach Q-Assessor uses.
It is worth emphasizing that at all points of the analytic algorithms, Q-Assessor’s re-implementations were tested against PQMethod’s — the putative gold standard — to confirm that Q-Assessor produces the same results in a spectrum of data sets.
You initiate your analysis simply by clicking on the “Redo Analysis” or “Review Analysis” links in the Data panel of the Study’s main summary page. This performs the calculations (or pulls them from where they have been cached in the database if done previously) and displays them in a “Primary Results” table at the top of the main Analysis page.
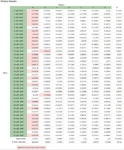
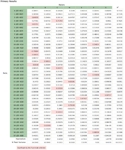
Here is Q-Assessor’s display of the initial unrotated factors of the illustrative Knowledge or Certainty sample data set. Note that prior to rotation, nearly all the significant responses are concentrated in the first factor. Note also that Q-Assessor automatically includes the eigenvalues and communalities. |
|
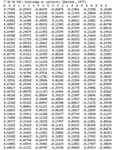
Here for comparison is PQMethod’s display of the initial unrotated factors of the same “Knowledge or Certainty sample data set”. Note the numeric values for the factors are, apart from trivial rounding differences, identical to Q-Assessor’s. PQMethod does not automatically flag significant cells, however. |
|
Q-Assessor now allows the investigator to pre-determine the number of centroid factors that the processes extract. Although there is no basis for this in Brown’s book (cf the Factor Analysis section of chapter 4), a number of investigators accustomed to PQMethod have asked for this “feature” and so we have included it. We are uncertain why this was added to PQMethod, as the algorithms themselves discover how many significant factors reside in the data, and thus biasing the search with an arbitrary choice at the outset makes no sense to us. Nevertheless Q-Assessor empowers investigators to limit the search for factors in this fashion if they so choose. The default setting is to extract the nominal seven factors, but investigators can simply recalculate their results with a single popup menu selection.
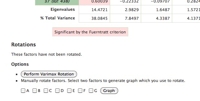
Rotating Factors
The next step in Q analysis is to perform factor rotations. There are two methods here as well: varimax and manual rotation. Q-Assessor lets you do either or both:
- You can perform only a varimax rotation.
- You can follow a varimax rotation with manual rotations.
- You can perform only manual rotations.
- You cannot perform a varimax rotation on top of manual rotations — nor would you want to do so.
We happen to believe that varimax is superior to manual rotations — particularly in large data sets where the visualized data look sufficiently cloud-like that we doubt the veracity of manually-selected rotations. However, you can experiment around, review the results immediately, and see what makes the most sense for your study.
Here is the Rotations section (under the Factors Table) before any rotations have been done — showing the various alternatives. |
|
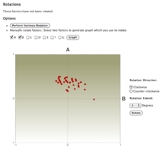
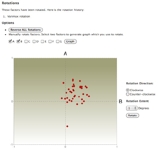
Here is the Rotations section when factors A and B have been selected for graphing — along with the visualized result and the interface for specifying a rotation. |
|
Next we show the effect of a manual rotation. Q-Assessor takes the angle and direction you specify, recalculates all the factors, redraws the graphed factors, and updates the rotation history. Note that Q-Assessor now provides an “undo” button that lets you reverse all rotations done to date, so you can easily experiment and start over if you don’t like your results. |
|
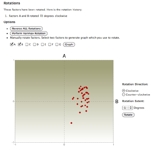
Q-Assessor automatically also redraws the entire Factors Table as well with each rotation, so you can see the total impact of any such manipulation. In this case, the rotation mostly transferred significance from factor A to B — which isn’t really very useful. Nevertheless, the important point is that Q-Assessor lets you see clearly and immediately the effect of any manipulation you try. |
|
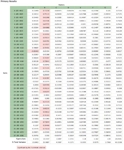
As we previously stated, we think that Varimax is much more effective than attempts at manual rotations — particularly for larger studies. Here is the impact of a Varimax rotation on the same data set. Note: Q-Assessor always does a Varimax rotation on the original, unrotated factors. You can do manual rotations on top of a Varimax rotation — though this is unlikely to provide any benefit. If you want to abandon the Varimax rotation and instead go back to manual rotations, simply click the “Reverse All Rotations” to restore the original, unrotated factors. |
|
Ordinarily, we think that best practice for Q-Assessor users is simply to do a Varimax rotation on their data and then proceed to the final report. However, if you want to continue to try to tweak your results, you can do a Varimax and then re-visualize factors to see what more you might try. Here are factors A and B re-graphed after the Varimax rotation. It is not obvious to us what manual rotation might be useful, so we would conclude the rotations at this point. Still, Q-Assessor lets you accumulate as many manual rotations as you like in search of the results you seek. |
|
The Final Report
Once you’re done with rotations, all data manipulations are completed, so it’s time to review the findings. Q-Assessor makes this exceedingly easy.
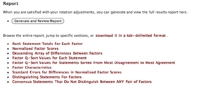
Just below the Rotations section of a Study’s Analysis page is the Reports section. Q-Assessor will produce a full report identical to that produced by PQMethod simply by clicking the “Generate and Review Report” button. |
|

Clicking that button opens up the report just below, beginning with this set of links that jump you directly to specific parts of the report. |
|
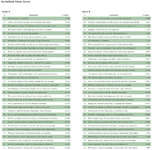
The rest of the report is self-explanatory. Here are screen-shots of the individual sections for this sample data set. In some cases we show only part of a given section — when the section too long to view without scrolling.
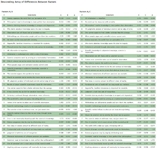
Rank Statement Totals For Each Factor |
|
Normalized Factor Scores |
|
Descending Array of Differences Between Factors |
|
Factor Q-Sort Values for Each Statement |
|
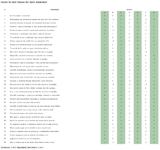
Factor Q-Sort Values for Statements Sorted From Most Disagreement to Most Agreement |
|
Factor Characteristics |
|
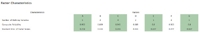
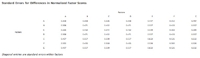
Standard Errors for Differences in Normalized Factor Scores |
|
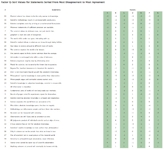
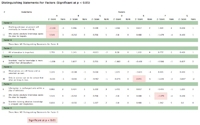
Distinguishing Statements For Factors (Significant at p < 0.05) |
|
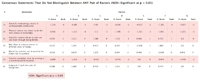
Consensus Statements That Do Not Distinguish Between ANY Pair of Factors (NON-Significant at p < 0.01) |
|
Downloading the Report
While we expect that most investigators will interact with their study’s data primarily live online, at the point of manuscript preparation or other reporting step, it is useful to have the report results down on your own computer. Q-Assessor packages up the entire report in a tab-delimited file format and lets you download it simply by clicking the “Download Report” link. You can then cut&paste or otherwise process the report in whatever fashion you like.
Integrating Sorts, Interviews, and Factors
In many studies, the investigator will want to interpret the results from participants’ sorting responses with the ancillary information they provided in their answers to interview questions. Q-Asssessor makes this easy to do by tagging each sort and each interview with an identifier that is unique to a specific participant. This identifier then establishes within the table of raw sort responses which participant contributed which sort, and similarly shows which participant’s interview answers are which. Finally, in the factors table in the analysis section, each row is likewise identified by the participant ID.
Thus, if the investigator wants to correlate all of these tables — the raw sort responses, the interview answers, and the calculated factors for each participant — the investigator simply downloads the data from each section using the data download links provided there. These data downloads deposit tab-separated-value files on the investigators computer. Then the investigator can simply import these files into whatever analysis tool they’re using — SPSS, SAS, R, or Excel — to merge the three data sets into one large table, where each line is for each participant.
Q-Assessor does not perform this giant merge process at this time, since the specifics of the import (i.e. the order of the columns in such a merged table) likely will vary from investigator to investigator. The best compromise between simplicity and flexibility, we think, is to give the investigator these units of data — the sorts, the interviews, and the factors — and allow the investigator to merge them as they want. We will continue to monitor feedback from users, though, and may provide further automation of this process at whatever point that appears to be desired and reasonable.
Understanding Your Results
The most complicated and controversial portion of any Q study then consists of making sense of whatever the study discovered. Q-Assessor cannot tell you what your results mean, but we do provide some general principles for making sense of your results.
Created: August 04, 2010 17:41
Last updated: September 14, 2017 19:51
Comments
No comments yet.
To comment, you must log in first.